

3D furniture configurator adoption is no longer a luxury for SMB furniture retailers in 2024—it’s a necessary response to changing buyer behavior, rising competition, and measurable demand for immersive, accurate, and customizable product experiences both online and in-store.
Key Takeaways
- Implementing a 3D furniture configurator with AR visualization can deliver up to 94% lift in online conversion, reduce returns, and increase average order value, but only if executed with technical and UX excellence.
- The biggest pitfalls are poor model quality, slow performance, inaccurate scale or color, friction in AR (like app downloads), and weak integration—each can sink ROI if not addressed up front.
- Get vendor-agnostic ROI by following a clear checklist: scope core features, budget realistically, prioritize web AR, validate technical specs, and integrate tightly with pricing, PIM, and analytics systems.
- Why now — market opportunity and buyer demand
- The quantified business case (conversion, AOV, returns)
- Top user frustrations that kill conversions (what your product must avoid)
- Three often-overlooked content/UX subtopics to win search and conversions
- Implementation cost breakdown (SMB realistic budget ranges)
- Accuracy: how close is AR to real-world scale and color?
- Technical spec checklist for vendor evaluation
- Integration & data flow diagram (how it should fit into your stack)
- Performance & UX requirements (latency, model polycount, progressive loading)
- Content strategy: 3D assets, photography, swatches, and AR-ready models
- Measurement plan — KPIs, A/B tests and attribution
- Launch roadmap & minimum viable scope for first 90 days
- Post-launch optimization and scaling (analytics, content ops, localization)
- Vendor selection rubric & red flags
- Quick reference appendix (pricing scenarios, checklist PDF items)
- FAQ
Why now — market opportunity and buyer demand
The 3D furniture configurator and AR furniture visualization markets are booming. In 2024, the 3D visual product configurator market hit approximately $1.75B with 12% annual growth, driven by urgent consumer demand for more control, assurance, and transparency when buying furniture online. Industry studies show that 60–62% of shoppers say visualization is their core pain point, and nearly 61% prefer retailers offering AR tools—with 71% saying they’d buy more if AR were available. By 2025, over 100M consumers are expected to use AR to shop for furniture, with the broader furniture e‑commerce market projected to break $400B globally.
[1],
[2]

The quantified business case (conversion, AOV, returns)
Evidence points to hard ROI for retailers investing in 3D furniture configurators and visual CPQ (configure-price-quote) tools. According to recent Shopify data, the addition of 3D/AR content led to a 94% higher conversion rate for online retailers. Visual CPQ streamlines configuration, pricing, and quoting, reducing manual effort and lowering errors that lead to returns. It’s not just about initial sales lifts—average order value (AOV) also climbs as customers confidently customize and upgrade components.
[5]
For most SMBs, these improvements translate to a 2–5% AOV lift and at least 30–50% reduction in calls for manual price quotes or basic product questions. When properly targeted, return rates drop due to better shopper expectation alignment.
Top user frustrations that kill conversions (what your product must avoid)
Not every 3D or AR tool is a conversion driver. The most frequent reasons customers abandon custom sofa builder online setups or build your own sectional tools:
- Low-poly or cartoonish 3D models that look untrustworthy or cheap
- Slow loading times, lag, or interface delays—anything over 3–4 seconds increases abandonment risk
- Limited customization—few swatches, rigid dimensions, lack of modular options
- Inaccurate scale or poor spatial alignment in AR scenes
- Non-dynamic pricing or unclear upgrade costs
- Clunky, confusing, or non-intuitive UI/UX, especially on mobile
- Mandatory AR app downloads (most shoppers just exit at this barrier)
- No instant transitions from 2D product gallery to 3D/AR mode
Addressing these issues is essential for retailers targeting high completion rates and repeat purchases.
Three often-overlooked content/UX subtopics to win search and conversions
To outpace competitors, address these neglected but high-impact factors in your 3D configurator and AR furniture visualization stack:
- Scale & Measurement Validation: Ensure customers can overlay accurate furniture dimensions in their room; include tape guides, room scanning, or augmented grid overlays for AR.
- Realistic Material Rendering & Color Calibration: Use proper PBR materials, swatch photography under neutral light, and ensure visual consistency across devices; most complaints about “wrong color” stem from bad lighting or weak material maps.
- Zero-Friction AR Launch: Prioritize web AR (no app) so users can instantly view items in their space; just one tap on mobile and AR opens.
These UX factors are referenced in multiple studies as crucial for both search visibility and conversion. In fact,
research shows that shoppers will abandon if AR is gated behind an app or if furniture appears misaligned with their lighting or actual space.
Implementation cost breakdown (SMB realistic budget ranges)
Budgeting early avoids hidden costs. Here’s a realistic breakdown for SMBs entering the 3D furniture configurator and AR space:
| Cost Item | Low | Medium | High |
|---|---|---|---|
| SaaS Licensing (Configurator/AR Engine) | $600/mo | $2,000/mo | $8,000+/mo |
| 3D Model Creation (per SKU) | $250 | $600 | $1,500+ |
| AR Packaging & Hosting/CDN | Included | $500/mo | $2,500/mo |
| Integration/Development (one-time) | $5,000 | $20,000 | $60,000+ |
| Ongoing Content Ops/Support | $500/mo | $2,000/mo | $8,000/mo |
Most SMBs launch MVPs under $30k upfront plus $1k–$3k/month scaling to $60k+ for larger or custom builds. The abundance of SaaS vendors (market context) supports price competition at all tiers.
Accuracy: how close is AR to real-world scale and color?
Most AR furniture visualization tools promise accuracy, but a gap remains in real-world fidelity. Common sources of error:
- Poor camera/environment calibration leads to scaling errors (+/-10% is not unusual)
- False color due to poor swatch capture or bad light mapping—leads to buyer dissatisfaction
- Inconsistent lighting or lack of IBL (image-based lighting)
- No “anchor” objects or scanning, so AR objects float or overlap room features inaccurately
Best practices for accuracy include requiring AR engines that let shoppers calibrate using a reference object (like a sheet of paper), investing in professionally photographed material swatches, and regularly testing output on different devices and lighting conditions. Still, AR tooling in 2024 achieves only 85-95% “perceived” accuracy (by user assessment).
[7]
Technical spec checklist for vendor evaluation
All vendors will promise “easy integration”—but here’s the non-negotiable checklist to avoid future pain:
- Browser compatibility (Safari, Chrome, Firefox, Edge—must work on iOS and Android out of the box)
- Zero mandatory downloads; web AR must be supported (avoid app-only AR except for the rarest cases)
- 3D asset format support: GLB/glTF preferred; fallback to USDZ for iOS
- Rendering engine: WebGL (Three.js/PlayCanvas) or Unity for AR; confirm performance for both desktop and mobile
- Hosting/CDN: ideally usage-based, with global edge delivery for fast load times
- API/webhooks for product/PIM/CPQ, live price updates, and analytics events
- SLAs for performance (max load <2–3 seconds for initial view), SLA for downtime
- Analytics hooks (Google Analytics, GTM, first-party event logging)
Experts repeatedly state: avoid mandatory apps for most furniture brands since it creates avoidable customer friction.
[7]
Integration & data flow diagram (how it should fit into your stack)
A robust 3D furniture configurator and AR furniture visualization solution needs to be deeply integrated—not bolted on. At minimum, plan for:
- Realtime sync with your PIM or CMS for SKUs, attributes, and copy
- Pricing and CPQ updates pulled via API or webhooks (ideally instant quotation)
- Order capture routed to your e-commerce platform (e.g., Shopify, WooCommerce, Magento)
- Asset pipeline pushing new 3D models, textures, and materials
- Analytics events feeding directly into your attribution/analytics solution
- CDN for asset hosting and performance
Pitfalls: missing real-time pricing, slow product/PIM updates, orphaned SKUs, or disconnected analytics are all common in failed launches. Visual CPQ furniture stacks that connect pricing, configuration, and visualization deliver much lower error rates and support features like “build your own sectional” or complex modular assets.
[6]
Performance & UX requirements (latency, model polycount, progressive loading)
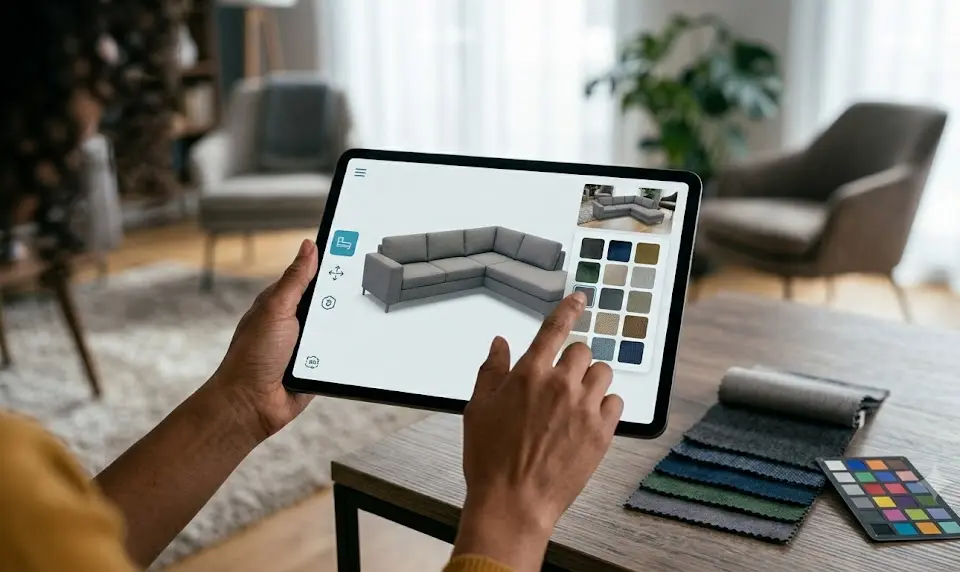
Your configurator must be mobile-first, supporting instant transitions from 2D gallery to interactive 3D. Performance factors that drive or kill conversions:
- Model polycount capped at 50K–150K for most assets—test on low-end phones
- Progressive/streamed loading for materials and textures
- Instant price feedback as users select options (delay is a sale lost)
- Mobile-optimized touch controls, pinch/zoom, and AR fallback if AR fails
Top user complaints in 2024 remain slow loading, lag, and crashes—directly correlated with lower conversion rates and higher abandonment.
[10]
Content strategy: 3D assets, photography, swatches, and AR-ready models
Start by selecting your top-10 bestsellers or most customizable products for your MVP. The 3D model creation workflow should prioritize:
- Photogrammetry or hybrid modeling for highly realistic shape/cushion details (see how modular sofa brands do it)
- color swatch photography under neutral, controlled lighting
- Material roughness/specularity mapped as PBR textures
- Lighting/IBL capture to match showroom or home
- Governance rules for asset updating—assign a 3D asset manager or product management lead
Quality matters: 62% of shoppers cited poor or missing visualization as their main barrier, so invest here first.
Measurement plan — KPIs, A/B tests and attribution
Mature teams measure:
- Conversion rate (targeting 94% lift vs baseline, per Shopify data)
- Average order value (AOV)
- Add-to-cart rate for engaged configurator users
- Return rate by configuration vs static SKUs
- Time-to-configure per session
Run A/B tests (e.g., 2D photos vs 3D configurator vs 3D + AR) on a rotating SKU set and attribute improvements using analytics event hooks tied to product and transaction IDs. Use results to unlock wider rollout or refine UX.
Launch roadmap & minimum viable scope for first 90 days
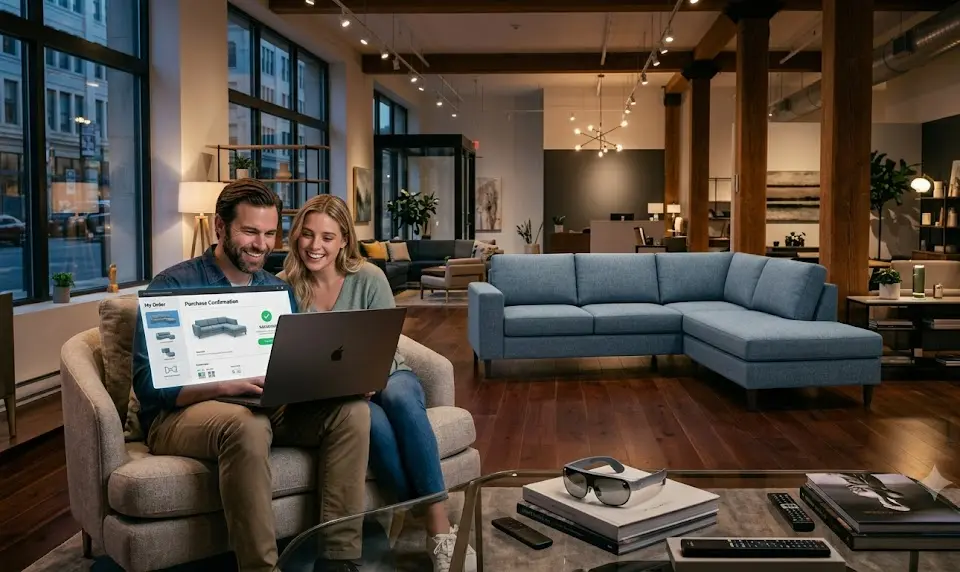
For the strongest time-to-value, focus on:
- Launching top 10 SKUs/custom sofa models as “build your own sectional”, 3D + AR enabled
- Mobile-first, web AR with no-download access
- Live pricing pulled from your CPQ or platform
- Cross-functional team: 1 PM, 1 3D artist (contract or agency), 1 frontend dev, optionally 1 AR integrator
- Pre-launch user testing with real customers
Set Go/No-Go criteria: if performance, pricing accuracy, or AR fails in test, do not launch (rework the weakest link).
Post-launch optimization and scaling (analytics, content ops, localization)
Once live, maintain your edge:
- Monitor loading and crash rates via analytics, tweak model size/LOD for slow devices
- Schedule new SKU onboarding quarterly or by customer demand
- Update color/material options seasonally—just like you would with physical swatches
- Add AR localization (language/assets) for growth regions
- Build SEO content around your configurator pages—add structured data/schema and ensure Google can crawl essential product text
- Assign staff to asset governance to avoid outdated visuals as furniture designs change
Brands with clear visual product configuration and transparent pricing are gaining market share as e-commerce furniture growth surpasses $400B.
[5]
Vendor selection rubric & red flags
Score all vendors on:
- Cost (TCO for first year and five years, including content and support)
- Time-to-live (from signoff to first SKU live)
- Performance (measured load and render times, analytics integration)
- Formats supported (3D, AR, web vs app)
- Integration ease and quality of documentation
- Support SLA (response times, bug fixes, onboarding help, roadmap transparency)
- Accessibility and SEO-friendliness
Hard red flags:
- Mandatory native app required for AR launch
- No live pricing integration
- No web AR support
- Poor asset governance (models/swatch updates lag weeks or months)
Remember—most SMBs have no business launching a standalone AR app. Web-first is best. For deeper AR or 3D furniture configurator technical guidance, see also how smart home buyers approach tech investments.
Quick reference appendix (pricing scenarios, checklist PDF items)
| Scenario | Low | Medium | High |
|---|---|---|---|
| Upfront cost (MVP, 10 SKUs, basic AR) | $12,500 | $30,000 | $75,000+ |
| Monthly platform fee | $600 | $2,000 | $8,000+ |
| Time to launch (working days) | 21 | 45 | 120+ |
Top 5 launch tests:
- Can shoppers use AR (web) in <1 click, no app required?
- Does 3D load under 3 seconds on iPhone and mid-tier Android?
- Are all customizations priced/previewed in real-time?
- Can you add to cart directly from configurator?
- Is every SKU/color/model accurate in AR compared to physical?
Immediate UX fixes to avoid: Don’t require users to download, don’t use low-poly models, and never force registration before configuration. For experience ideas, check our
home improvement tips and
living room upgrade tips.
FAQ
How long does it take to launch a 3D furniture configurator for my online store?
On average, an MVP launch for 10–20 SKUs takes 4–8 weeks, assuming 3D models are ready and your team can dedicate a PM, 3D artist, and a frontend dev. Custom work and complex integrations can extend this to 3–4 months.
What makes AR more effective for furniture ecommerce—web AR or native apps?
Web AR is far more effective for mass reach, with up to 80% more users engaging than with mandatory native apps. Only consider a native app if your brand is high-frequency, high-usage, or the AR workflow is extremely complex.
Can I reuse my photorealistic 2D photos for 3D/AR content?
2D photos are essential for fallback and thumbnails, but you’ll need dedicated 3D models and photo-captured swatches for true 3D/AR. However, 2D assets help bridge initial loading and boost SEO if combined properly.
How do I measure the ROI of my 3D furniture configurator investment?
Track conversion rate, AOV lifts, number of custom orders, time spent in configurator, and post-purchase return rates. A/B test against standard listings and attribute improvements to configurator engagement in your analytics platform.
What’s the biggest technical risk when adding 3D/AR to my current tech stack?
The most common risk is performance drag—slow loads, crashes, or broken real-time pricing updates. Always prioritize load testing and real-time integration QA ahead of launch.
Authoritative and practical—include screenshots, diagrams, and budget breakdowns where possible. Aim for 1500–2200 words. Always cite data sources. For more smart investments, see this guide on buying smart home gear.
—